Gas shows in context
Chromatography and the wetness and balance ratios on the same depth as the rock description and the drilling response.
Horizontal wells, gas chromatography, gamma ray and resistivity. BoreWatch reads the files the mud-logging and LWD contractors already deliver and lines them up with the cuttings description, well by well and across the pad.
Free trial up to 6 months with your work email: 1 + 2 + 3 months, each step after a short feedback form. No card.
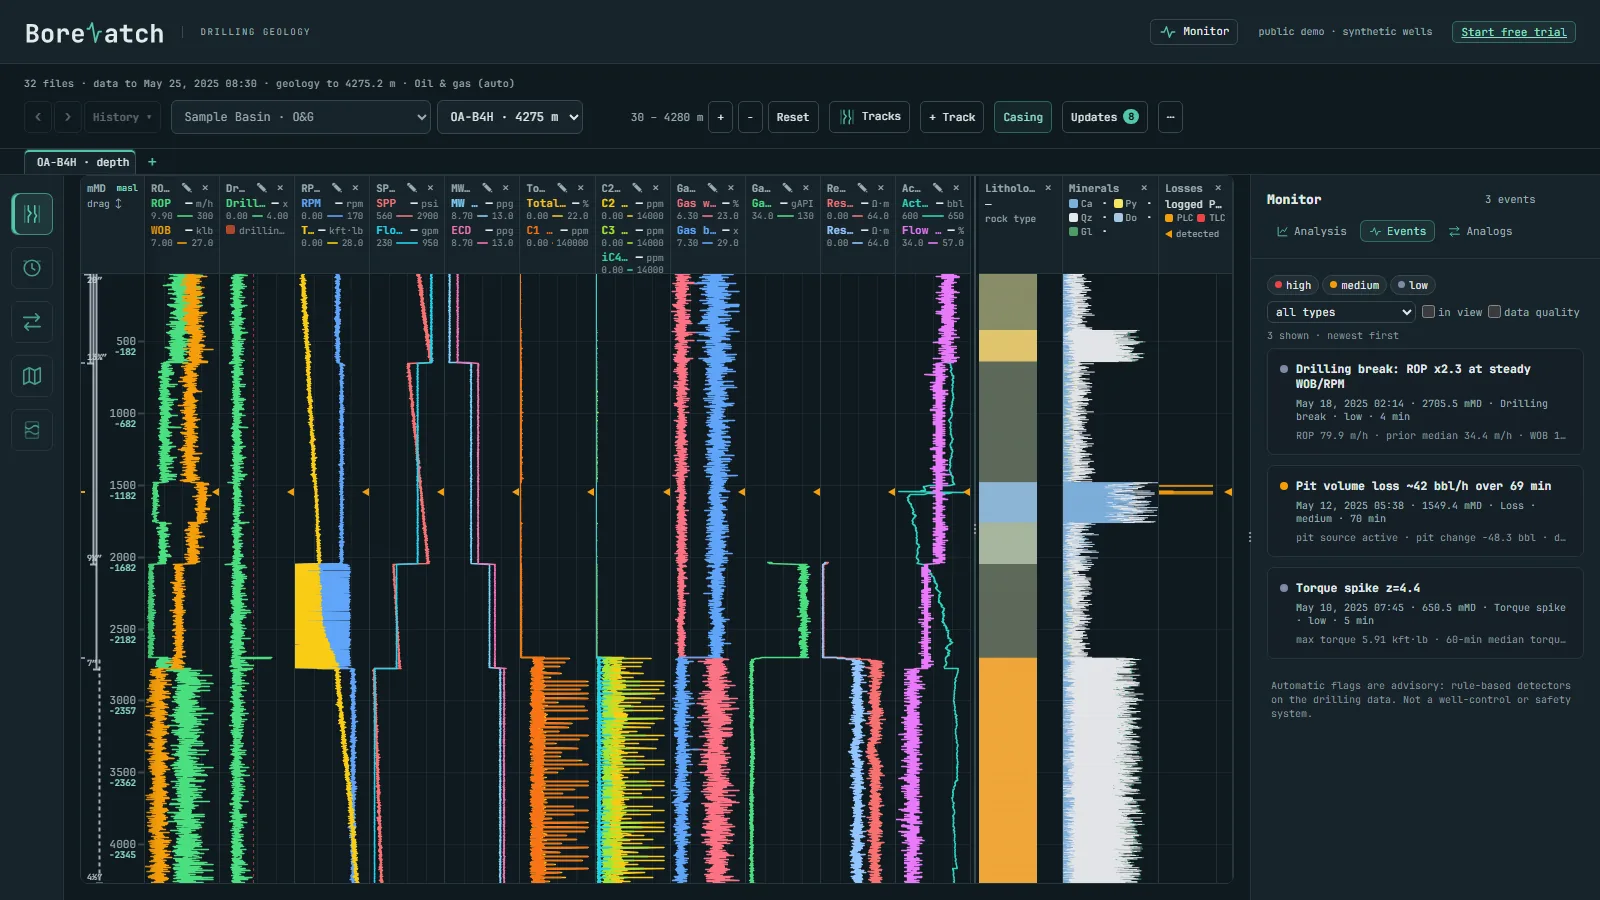
The local engine sorts the files by well, builds the tracks and flags the events as new data arrives.
Chromatography and the wetness and balance ratios on the same depth as the rock description and the drilling response.
Losses, gains, drilling breaks, torque and pressure spikes, stick-slip and data gaps, each with its depth and time.
2 to 10 wells side by side on MD, TVD or elevation; plan view and 3D paths with any parameter coloured along the well.
Drop them into one folder on the Windows computer that holds the data. Column names and units are recognised automatically; the engine works out the industry of each well from its own data.
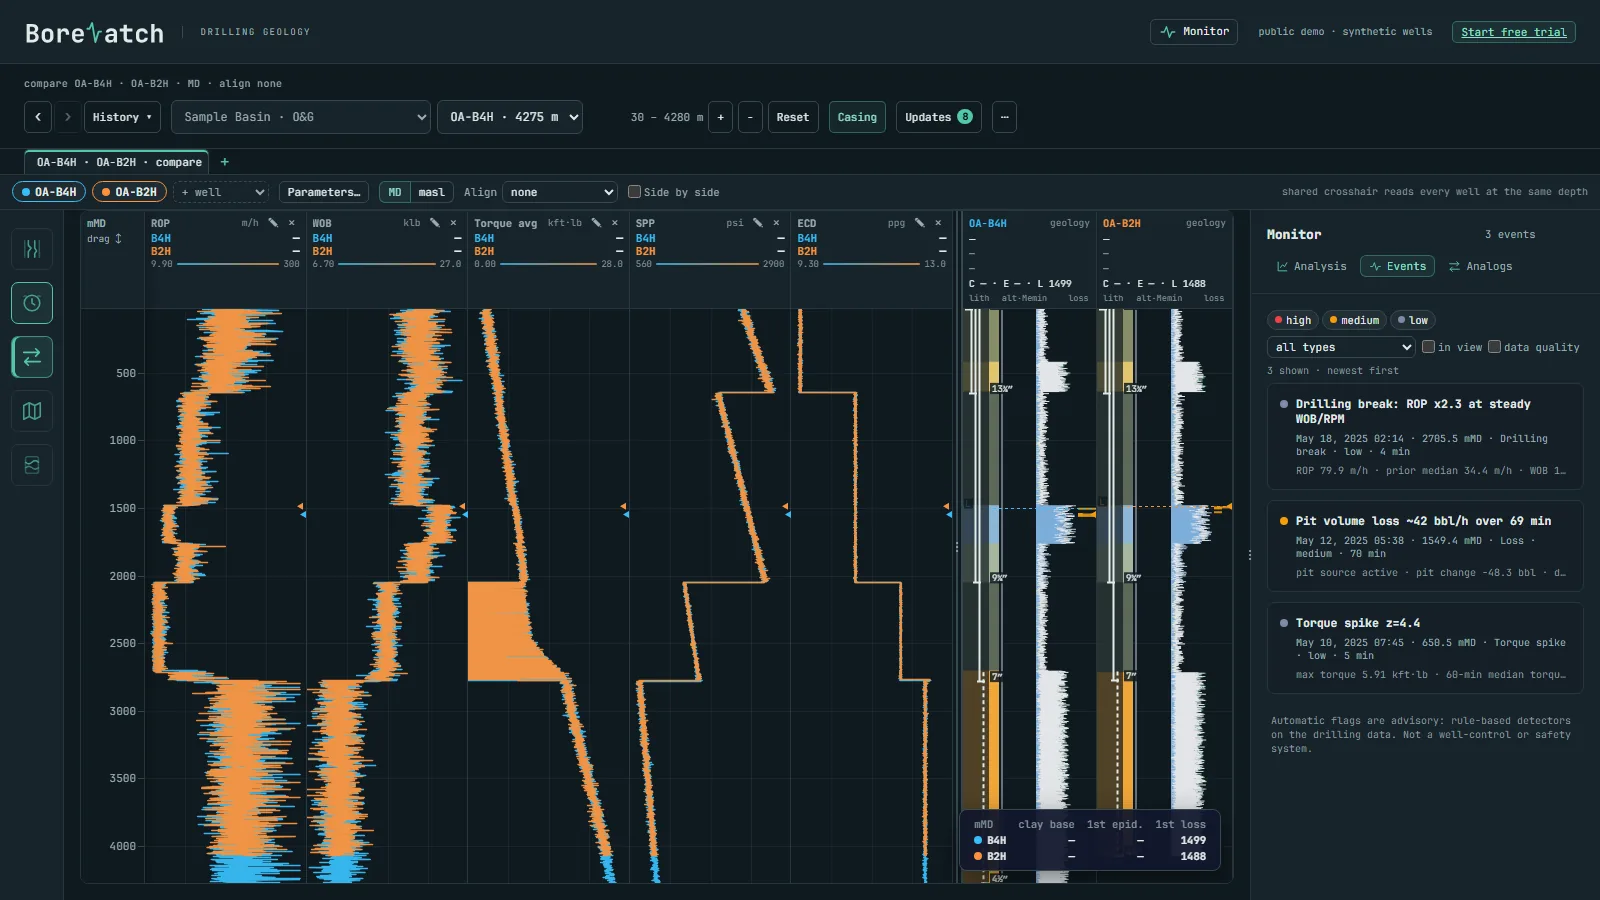
After every update the engine writes the files your modelling and log software imports: Petrel well heads, well paths, tops, logs and point well data; one LAS 2.0 file per well for Techlog, Interactive Petrophysics or WellCAD; GeoJSON for QGIS or ArcGIS.
Only encrypted dashboard data is synced; we cannot read it.
How your data is protected →Sign-in details, license key and the installer arrive by email.
A synthetic oil and gas field is included, so you see it working at once.
Drop your files into the folder; the dashboard fills in.