A slow walk through every view and menu, one page at a time. Each page shows a screenshot of the live demo, says what you are looking at, and how to use it.
Follow along. Open the live demo in another tab: it holds 21 synthetic wells from three fields (geothermal, oil and gas, mineral drilling) and needs no sign-up. Every screenshot here comes from it.
BoreWatch has two parts. The engine runs on the Windows computer that holds your rig files: it reads them, builds the well, flags events and encrypts everything. The dashboard is the web page where you look at the result. You install the engine once.
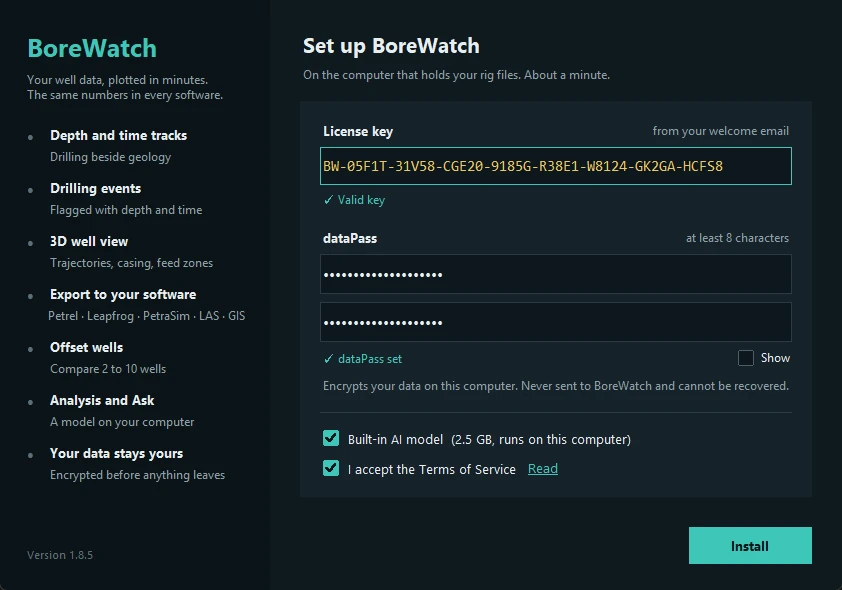
Fill in the setup window
Start a free trial. The welcome email holds the installer link, your username, password and license key.
Double-click BoreWatch-Setup.exe. It is code-signed and needs no administrator rights.
Paste the license key from the email. A green tick confirms the format.
Choose a dataPass of at least 8 characters and type it twice. It encrypts your data on this computer and is never sent to BoreWatch, so nobody can recover it for you.
Leave Built-in AI model ticked if you want analysis and Ask without an API key.
Tick I accept the Terms of Service (Read opens them). Install stays grey until everything is filled in; the hint beside it says what is missing.
Watch it install
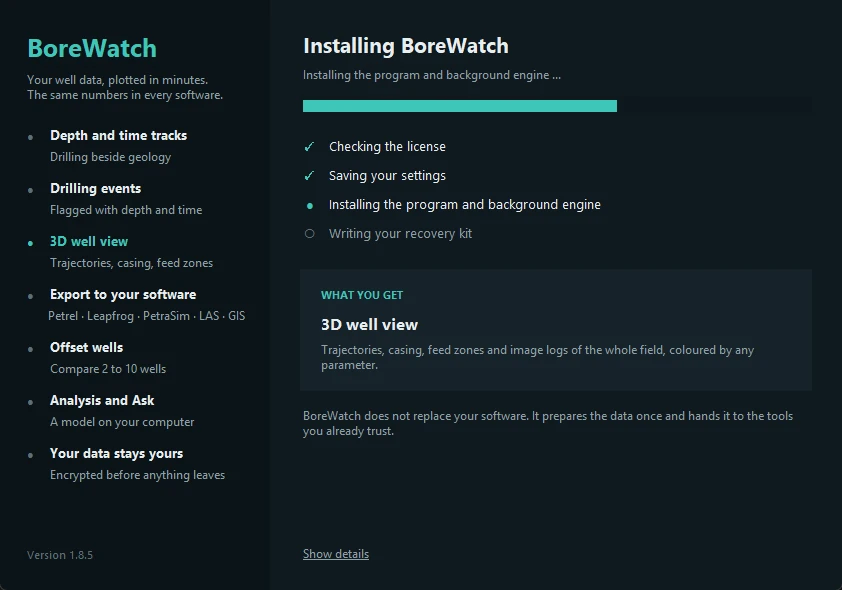
Setup shows each step with a tick as it finishes. The card below explains what BoreWatch does while you wait. Show details opens the technical log if you need it.
Print the recovery kit
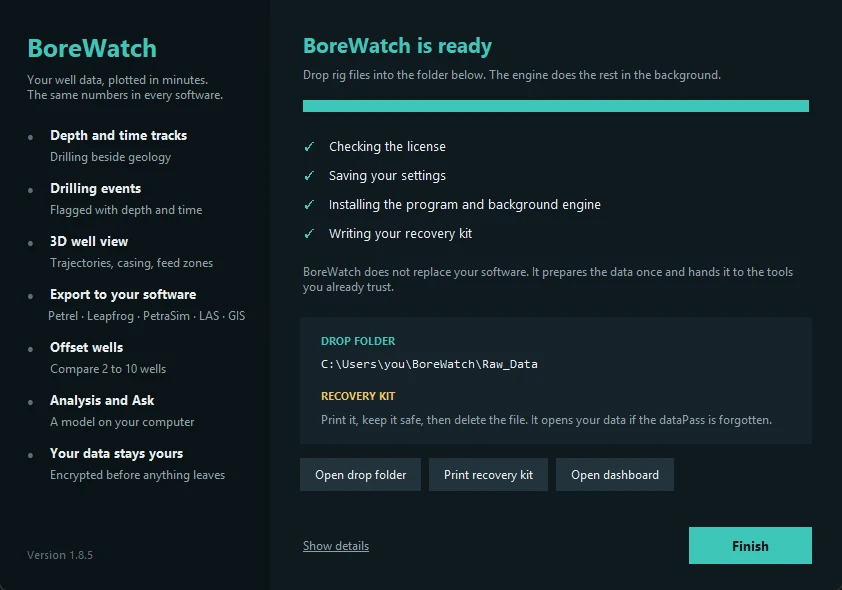
When setup is done it opens the drop folder (Raw_Data). Click Print recovery kit, keep the paper somewhere safe and delete the file: it is the only way back into your data if the dataPass is forgotten. The engine now runs in the background and starts with Windows.
Tip Drop rig files into Raw_Data as they come from the rig: mudlog CSV or XLSX, LAS, WITSML, geology, loss and survey tables, even ZIP files. No renaming, no sorting.
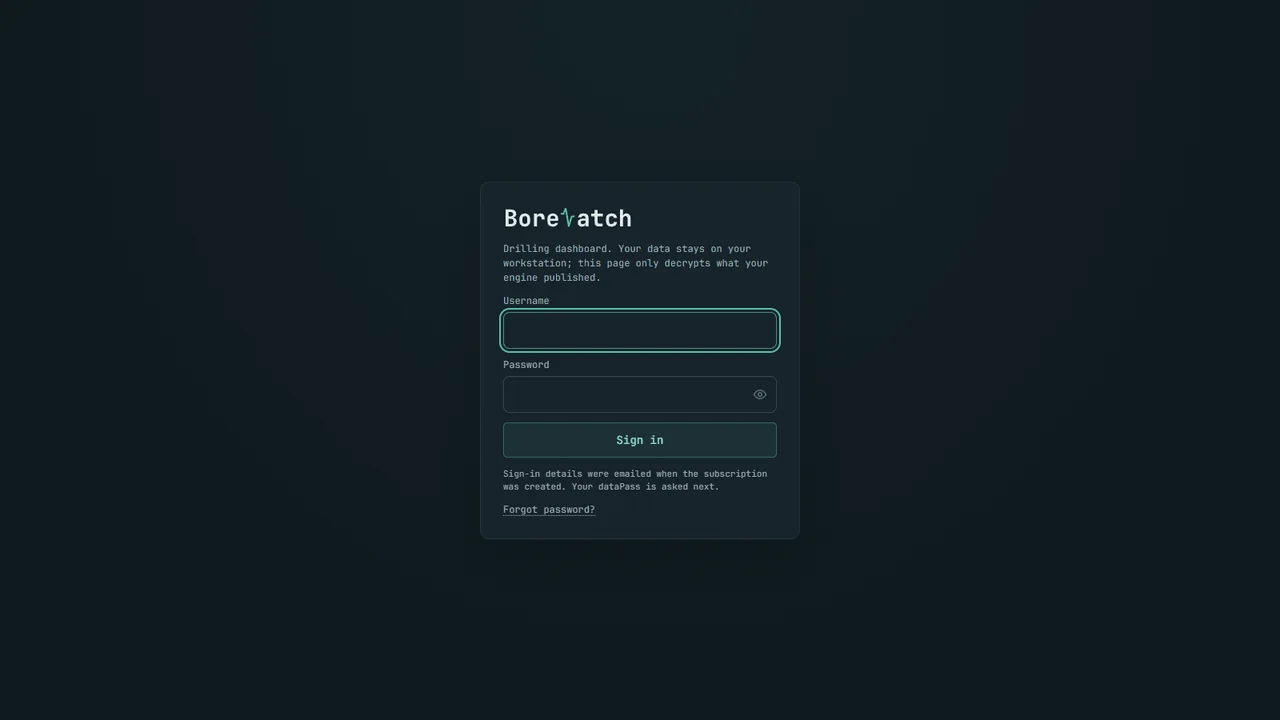
Type the username and password from your welcome email and click Sign in.
Type your dataPass. The browser uses it to decrypt your wells; it never leaves the browser.
Your wells appear and refresh by themselves as new files reach the engine.
Tip On a phone, add the dashboard to the home screen from the browser menu: it then opens like an app.
The workspace
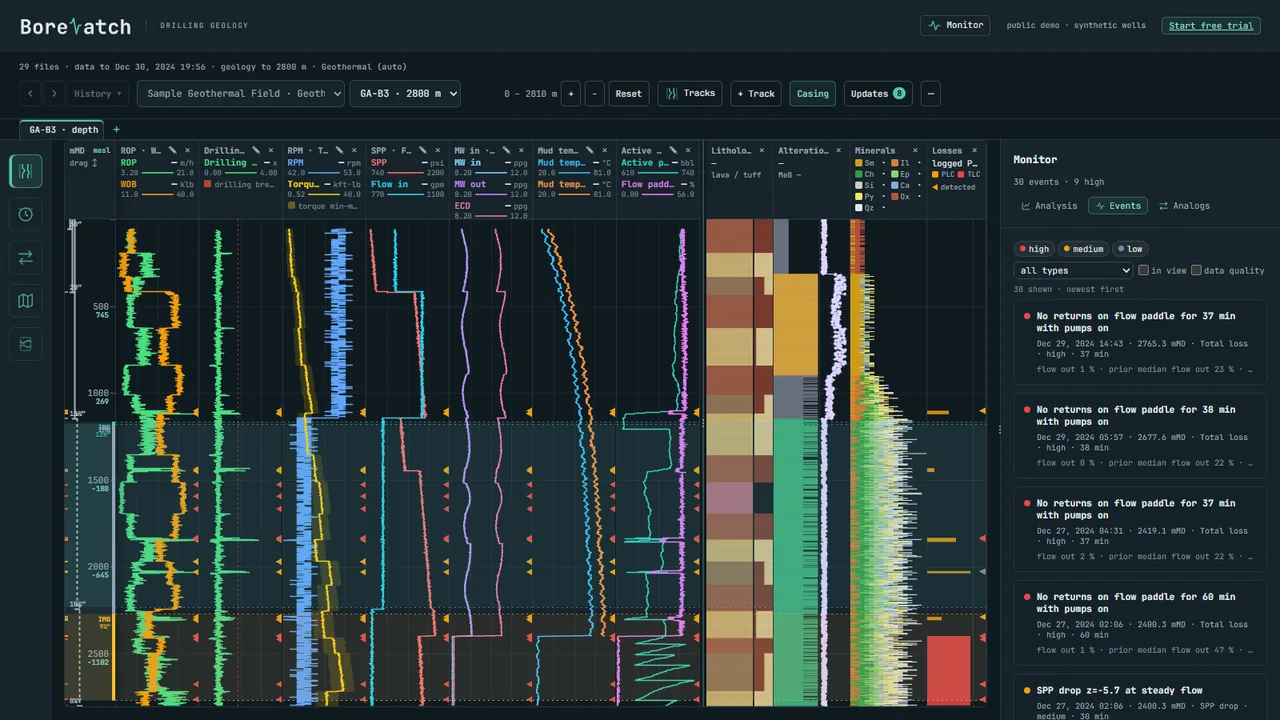
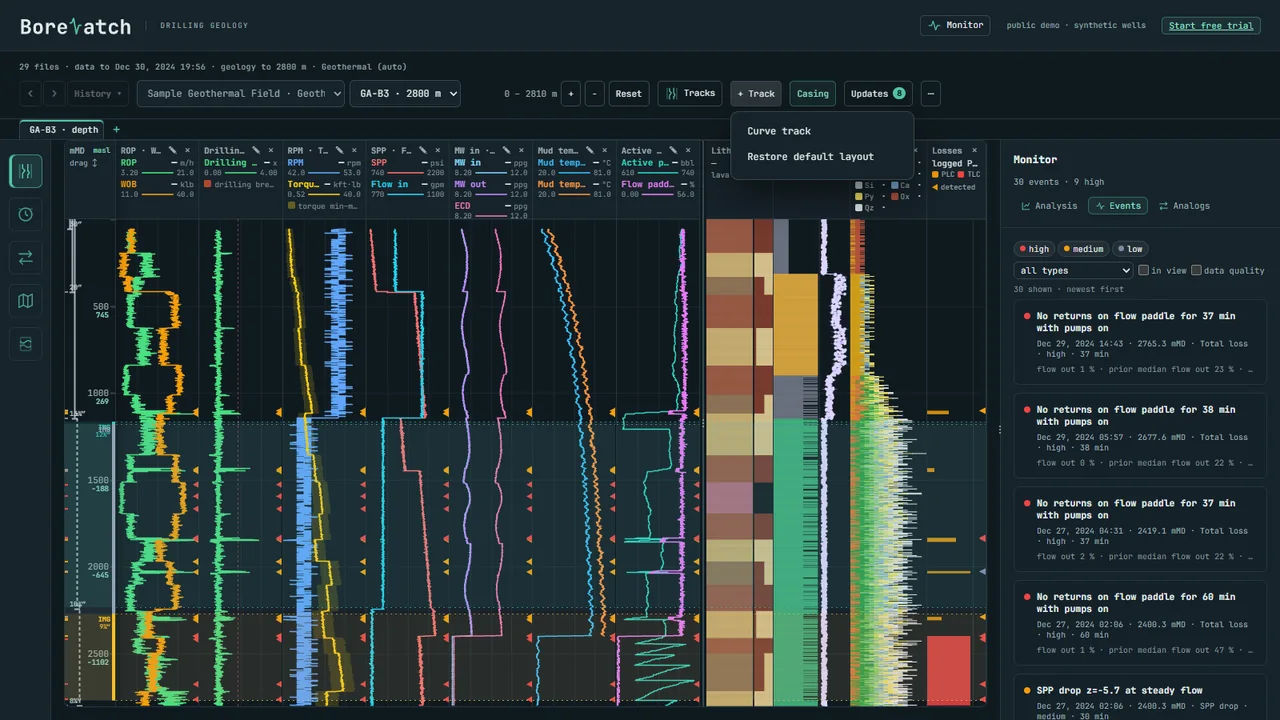
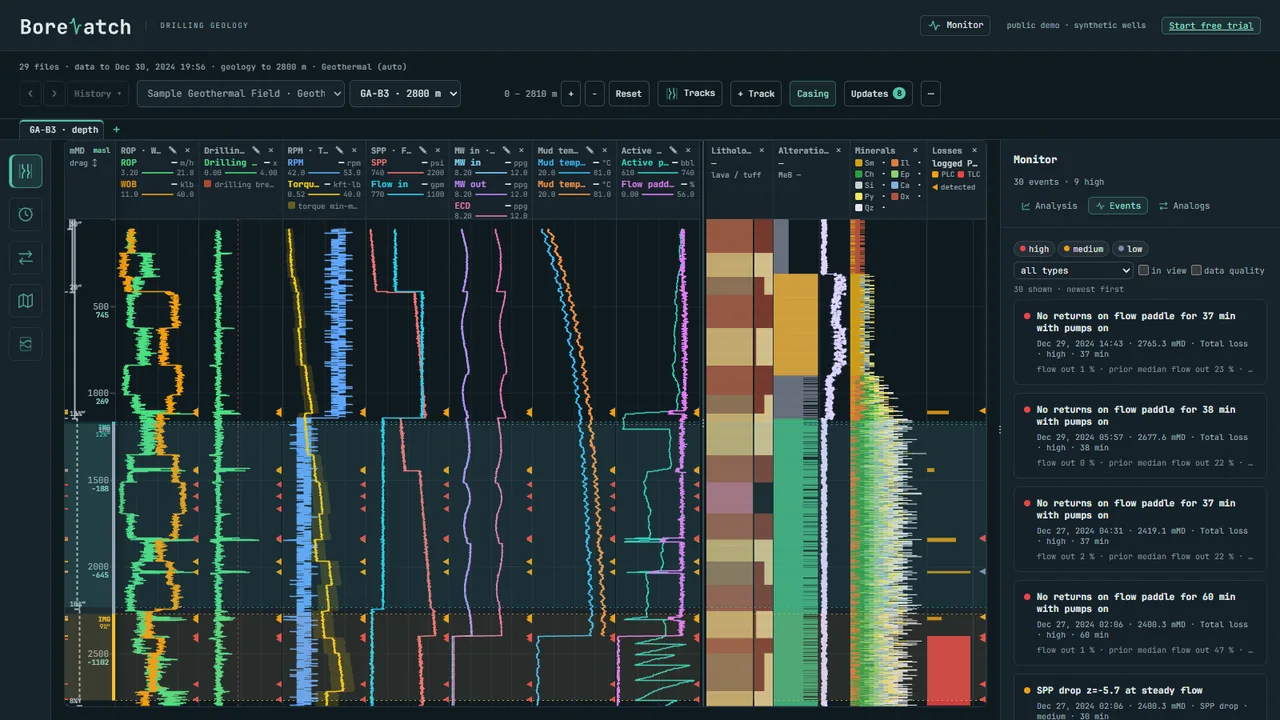
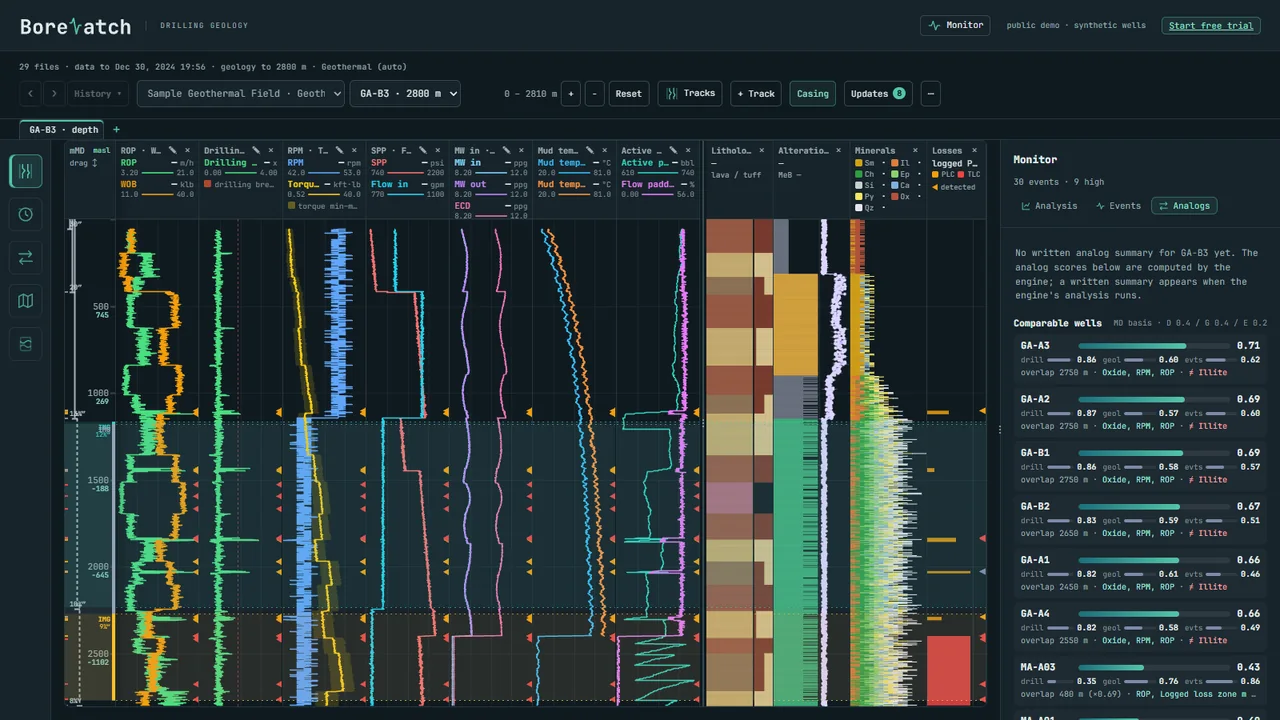
The screen has five parts. Take a moment to find each one.
1. The top bar
The BoreWatch logo, Monitor (shows or hides the panel on the right) and your account. In the demo the right side says public demo and offers the free trial.
2. The control row
From left to right: ‹ › back and forward through the views you opened, History, the field and well lists, the depth range with +, − and Reset, then Tracks, + Track, Casing, Updates and ⋯ (more tools).
3. The view rail
The icons down the left side switch the view: Depth, Time, Compare wells, Map and 3D and Image logs. The lit icon is the view you are in.
4. The tracks
Each column is a track: drilling parameters such as ROP, WOB, torque, pump pressure (SPP), flow and mud temperatures, then the geology: lithology, alteration, minerals and losses. Depth runs down the left edge in measured depth and elevation.
5. The Monitor panel
On the right: Analysis, Events and Analogs (and Ask in your own workspace). It lists what the engine found in the well.
Depth view
The depth view shows the whole well from top to bottom: every drilling parameter beside the rock that was drilled at that depth.
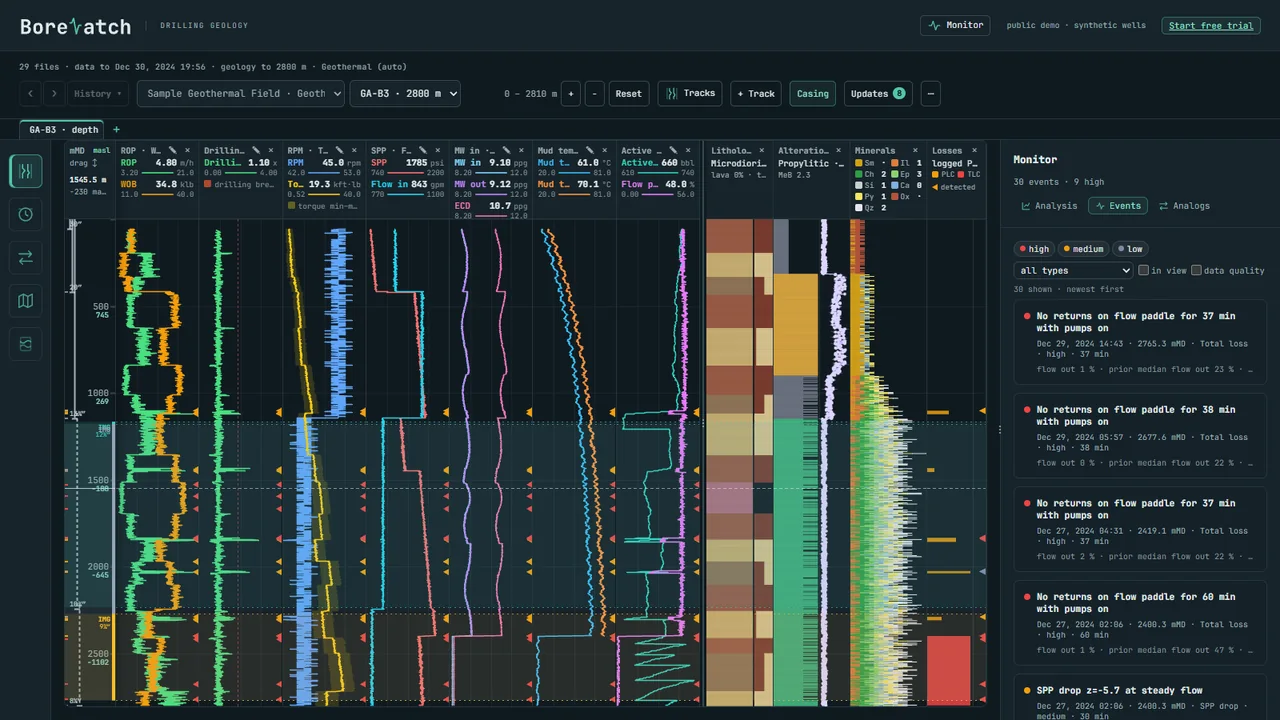
Read any depth
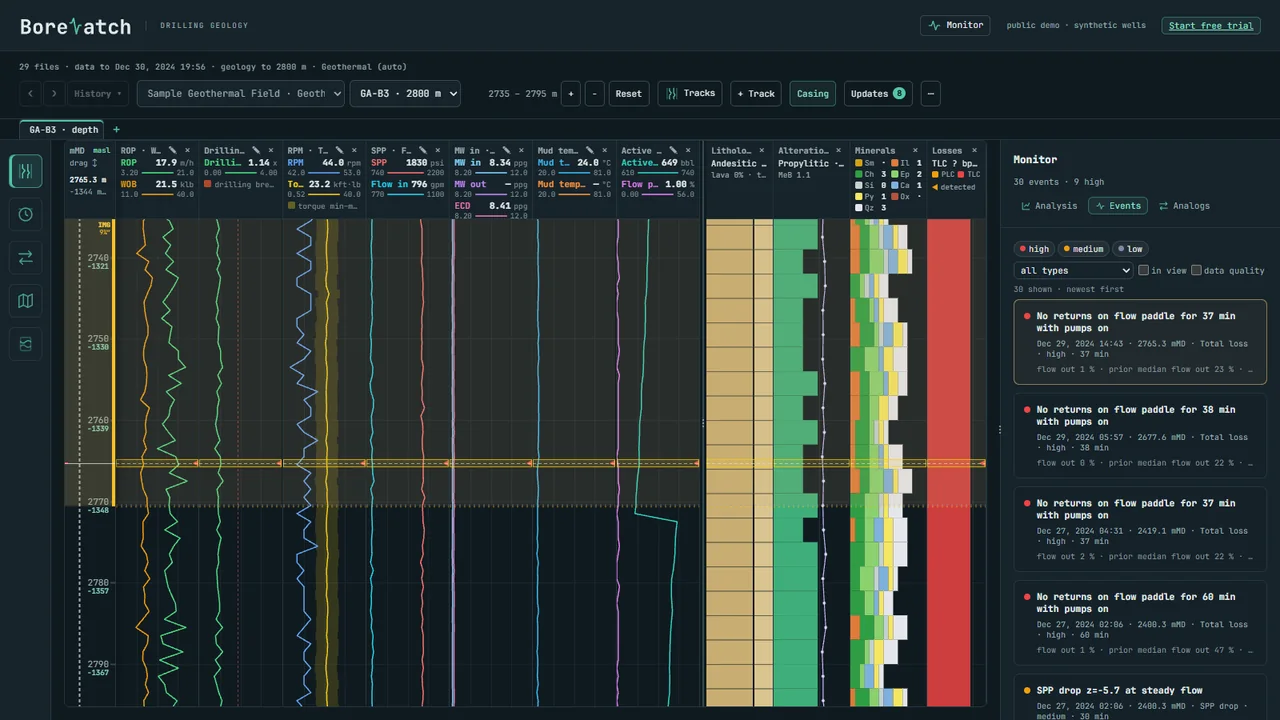
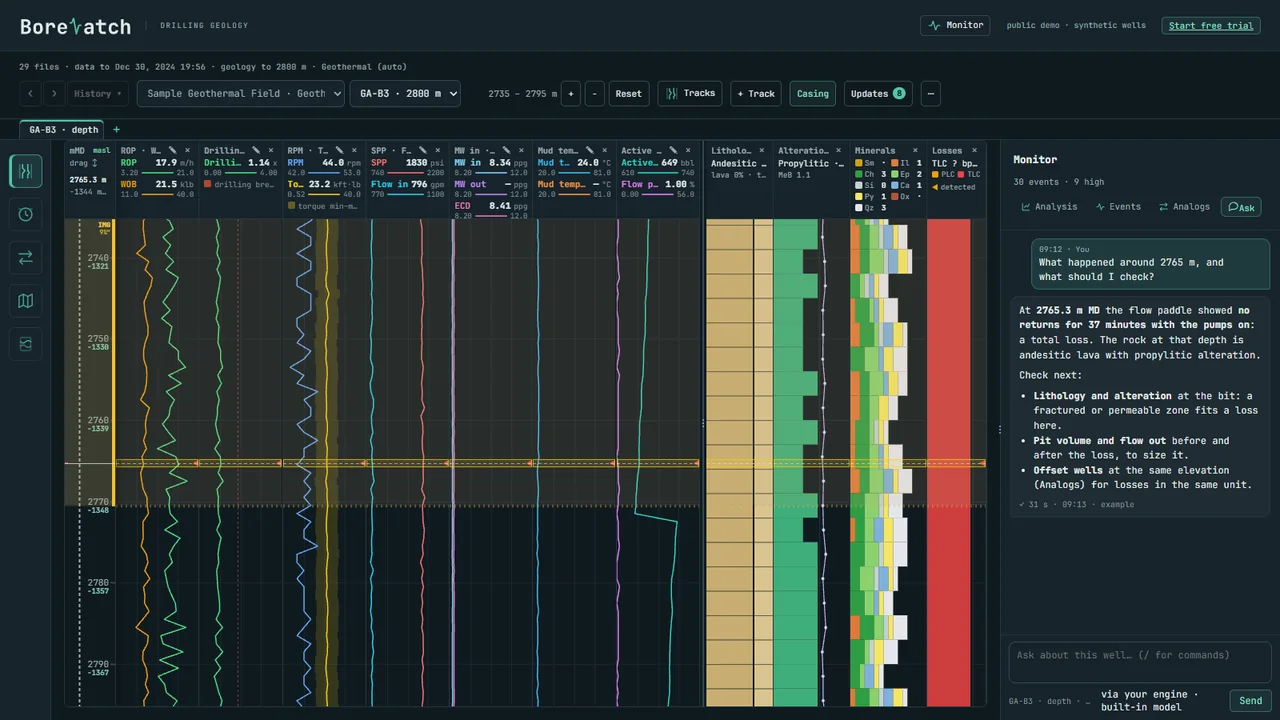
Move the mouse over the tracks. A line follows the pointer and each track header shows its value at that depth, so you can read ROP, torque and the lithology at exactly the same point.
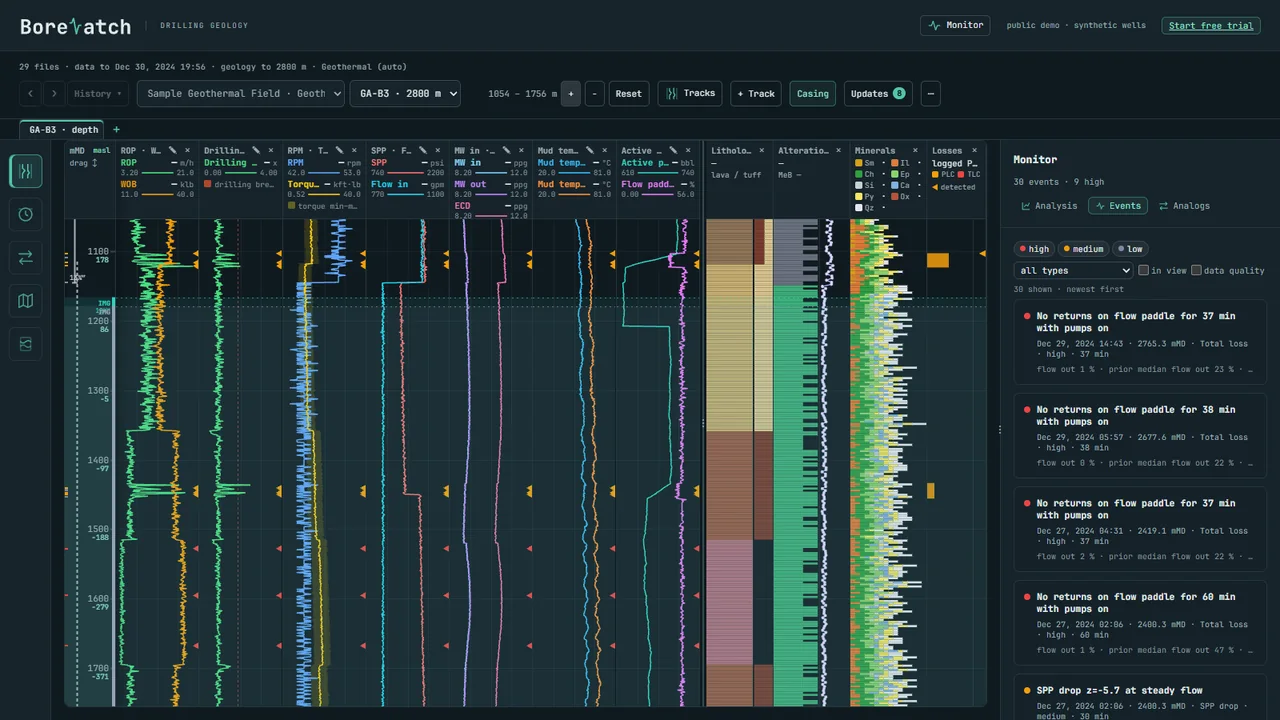
Zoom into an interval
Click + to zoom in around the middle, or scroll with the mouse wheel over the tracks.
Drag up and down to move through the well.
Click Reset to see the full well again.
Tip The range box in the control row always shows the depths on screen, for example 2735 – 2795 m.
Choose and arrange tracks
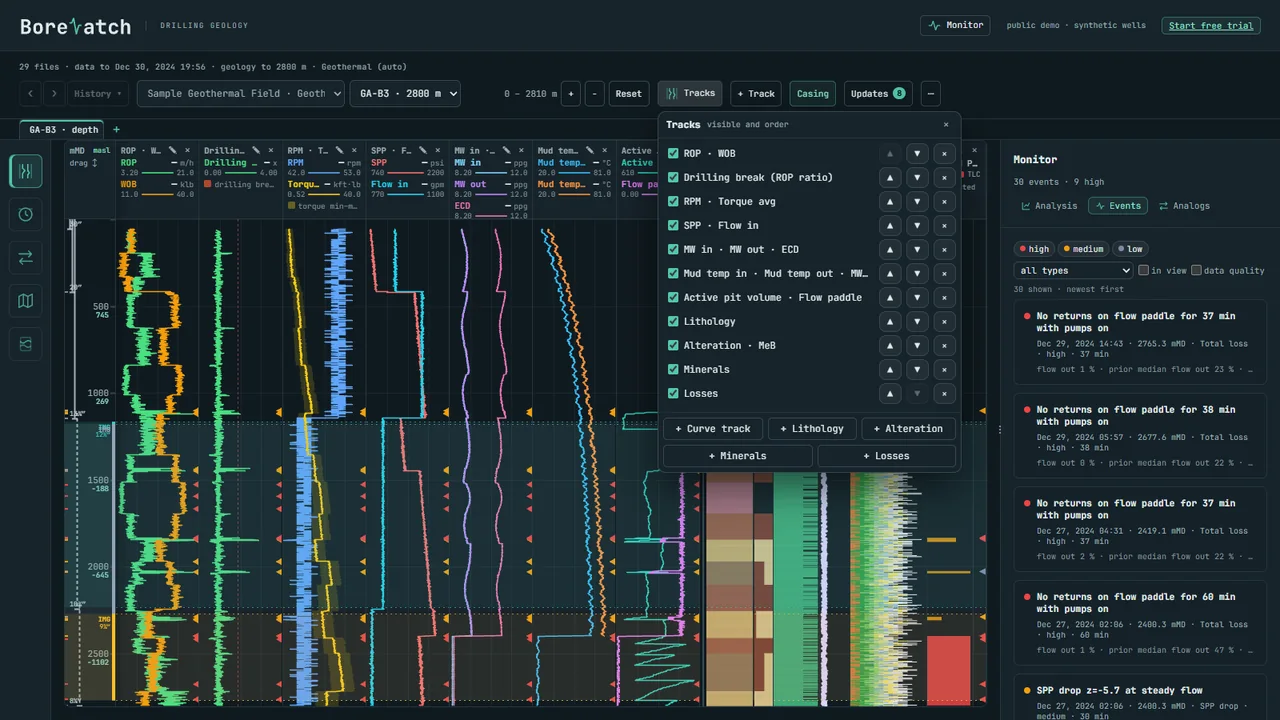
The Tracks list
Click Tracks. Every track is listed with a tick to show or hide it and arrows to move it left or right. The buttons at the bottom add a curve, lithology, alteration, minerals or losses track.
Add a track
+ Track adds a curve track where you pick the parameters to plot together. Restore default layout brings back the standard tracks if you have changed too much.
Tip Your layout is remembered in this browser, per well type, so it is ready the next time you open a similar well.
Casing
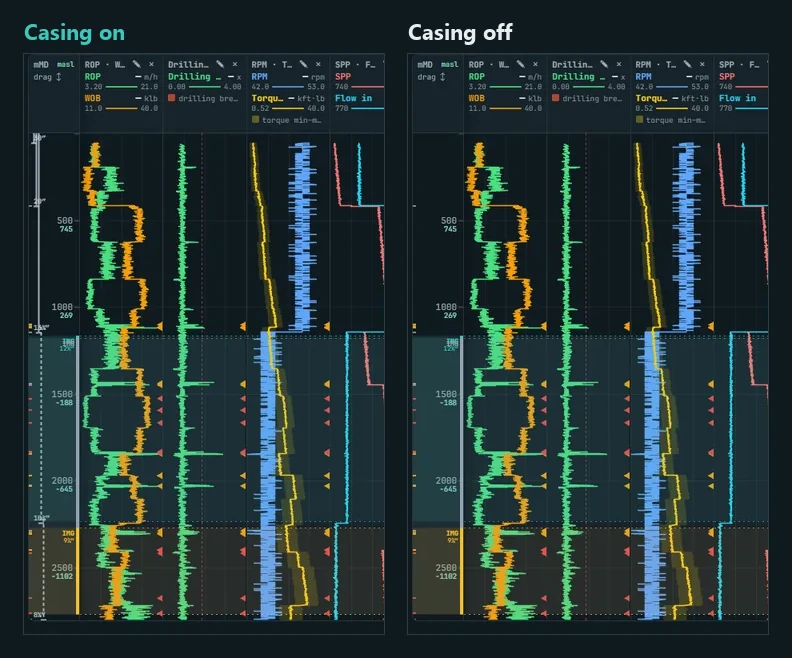
The Casing button shows or hides the casing strings and liners on the depth axis and in the compare tracks: with it on, each string is drawn down the axis with its size (20″, 13⅜″, 9⅝″) at the shoe. Turn it off when you want a clean view of the drilling curves; turn it on to see where each string was set.
Time view
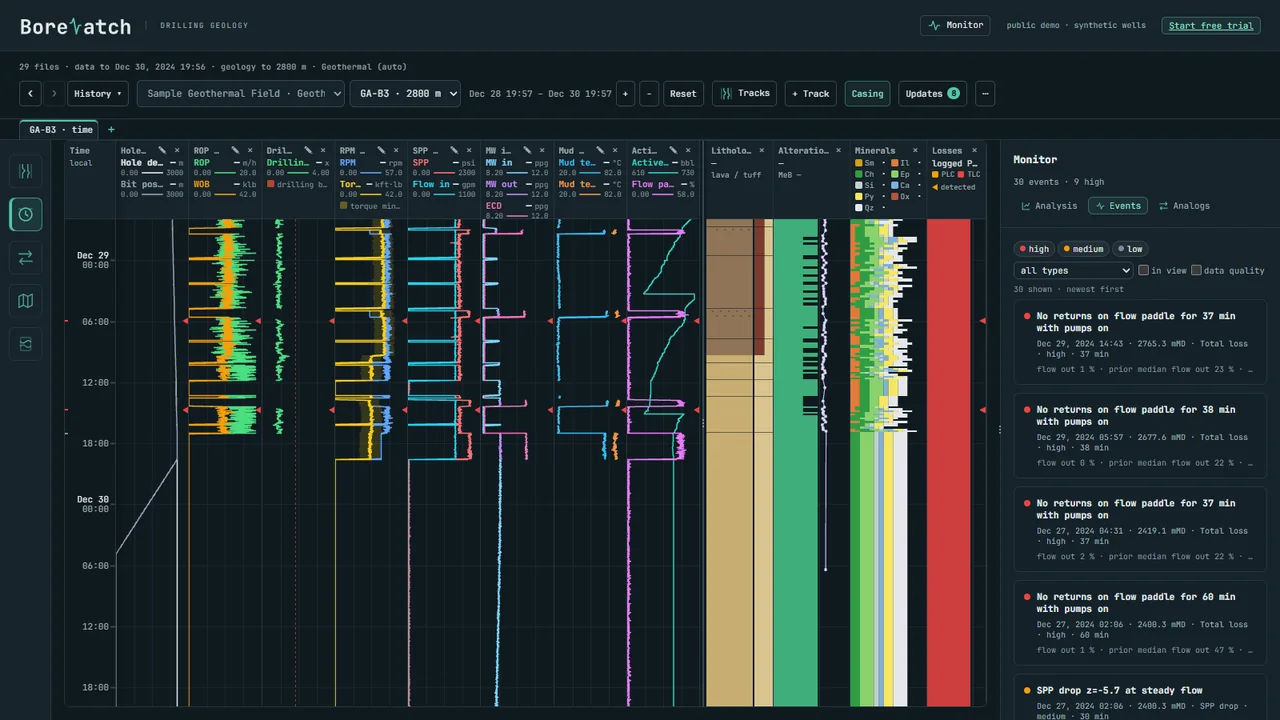
Click the clock icon in the rail. The same parameters are plotted against time, so you see the sequence of a shift: connections, trips, circulation and the moment a loss started.
Tip Use the depth view to find where something happened and the time view to see how it unfolded.
Go back to an earlier view
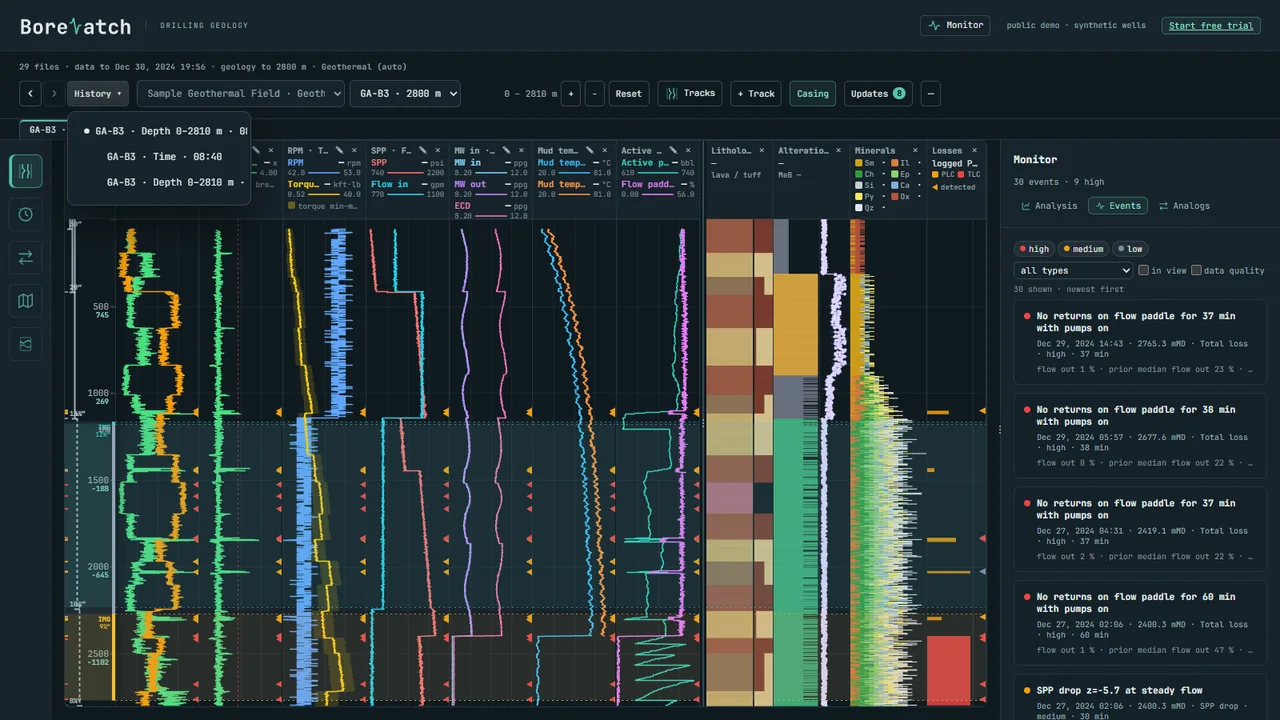
‹ and › step back and forward through the views you opened, like a browser. History lists them all, with well, view and depth range, so you can jump straight to one. Right-click ‹ or › for the same list.
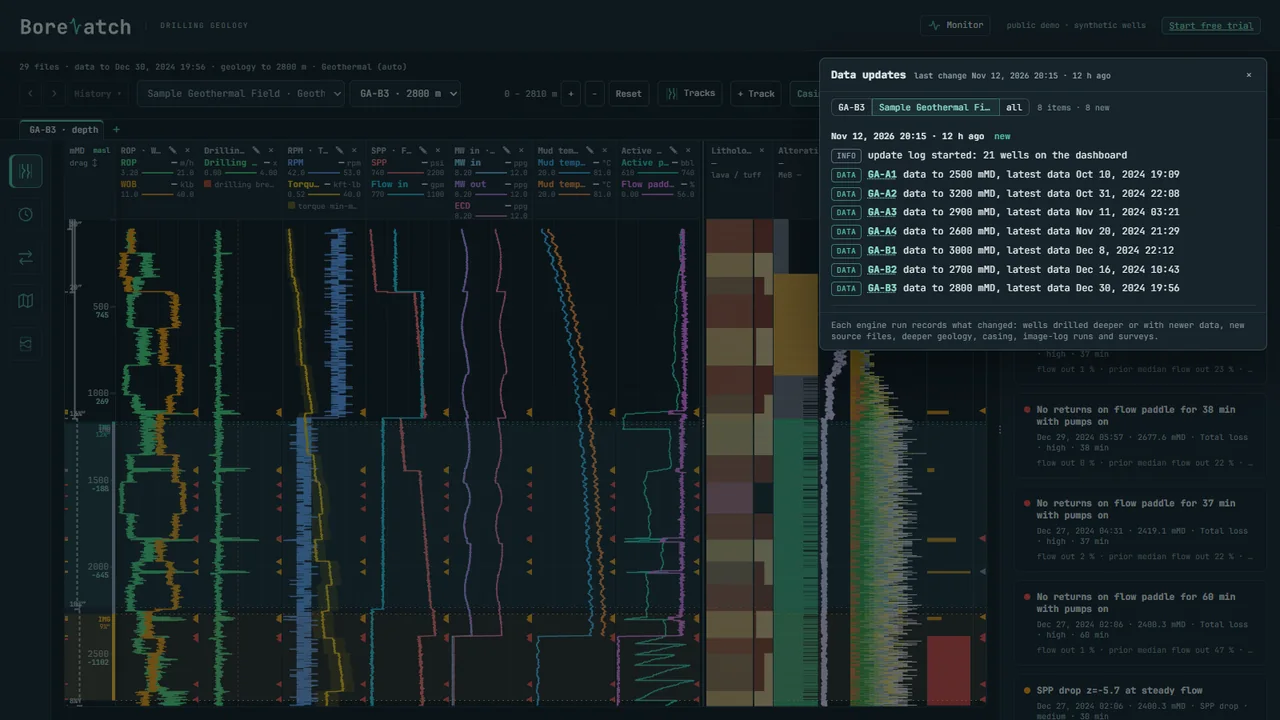
Data updates
Updates shows what reached the dashboard and when: which wells changed, the latest data time for each and new files. The number on the button counts what is new since you last looked.
Events
The engine checks every new file for drilling events: losses and gains, drilling breaks, torque and pressure spikes, flow and pit changes, and thermal changes. Each event card says what happened, at which depth and time, and how strong it was.
Filter by severity with high, medium and low, or pick one type in the list.
Tick in view to see only events inside the depth range on screen.
Tick data quality to also see sensor problems.
Jump to an event
Click an event card. The tracks zoom to that depth and the interval is highlighted, so you can check it against the rock and the other parameters.
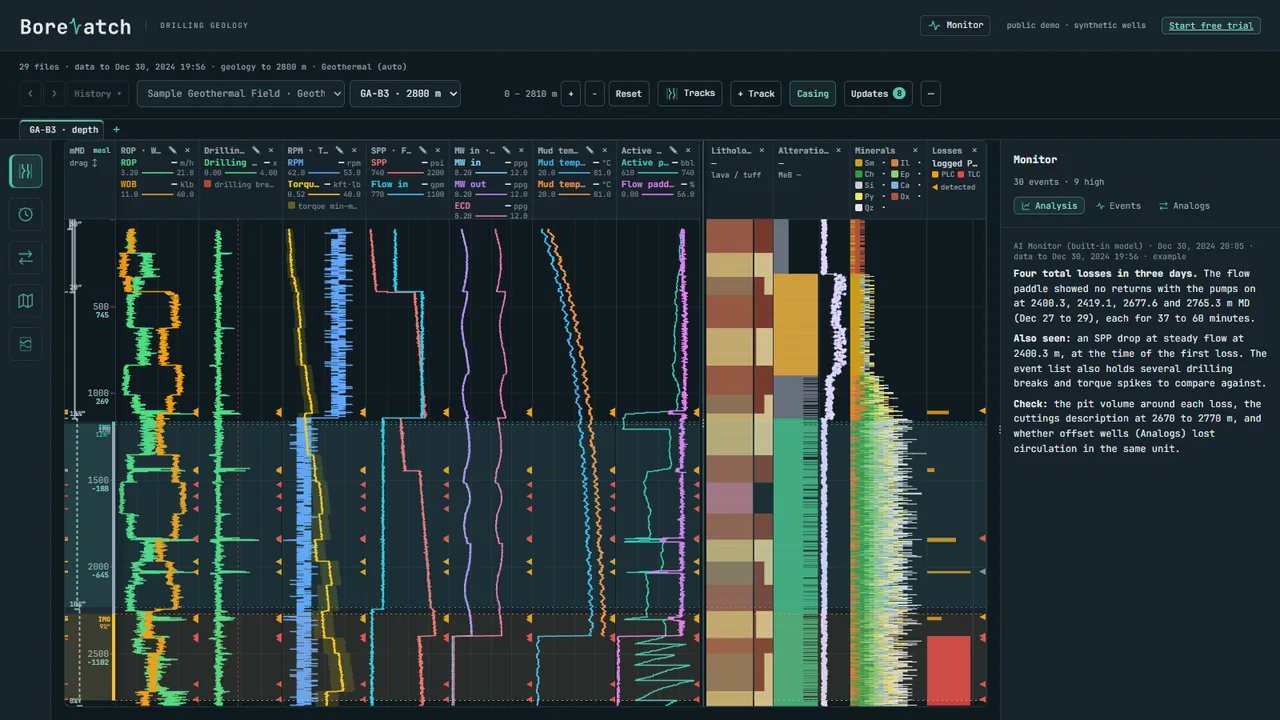
Analysis
Example note about the demo well's own events. The public demo has no engine, so this note was written for the tutorial.
Analysis holds short written notes about each batch of new events: what changed, what may explain it and which observations to check. The engine writes them on your own computer with the AI model you chose, so your data does not leave it.
Offset-well analogs
Analogs ranks the other wells by how similar they are to this one in drilling response, geology and events. Each bar shows the score and what drives it, and the table at the bottom compares every pair. Click a well or a cell to compare them side by side.
Tip Offset-well Analogs is an optional add-on; the trial includes it.
Ask about your well
Example question and answer about the event on screen. In the public demo there is no engine to answer, so this exchange was written for the tutorial.
In your own workspace the Monitor has an Ask tab. Type a question such as “What changed around this drilling break, and which observations should I check?”. The question is encrypted in the browser, answered by the engine with your model and sent back encrypted. The answer refers to the well and depth range on screen.
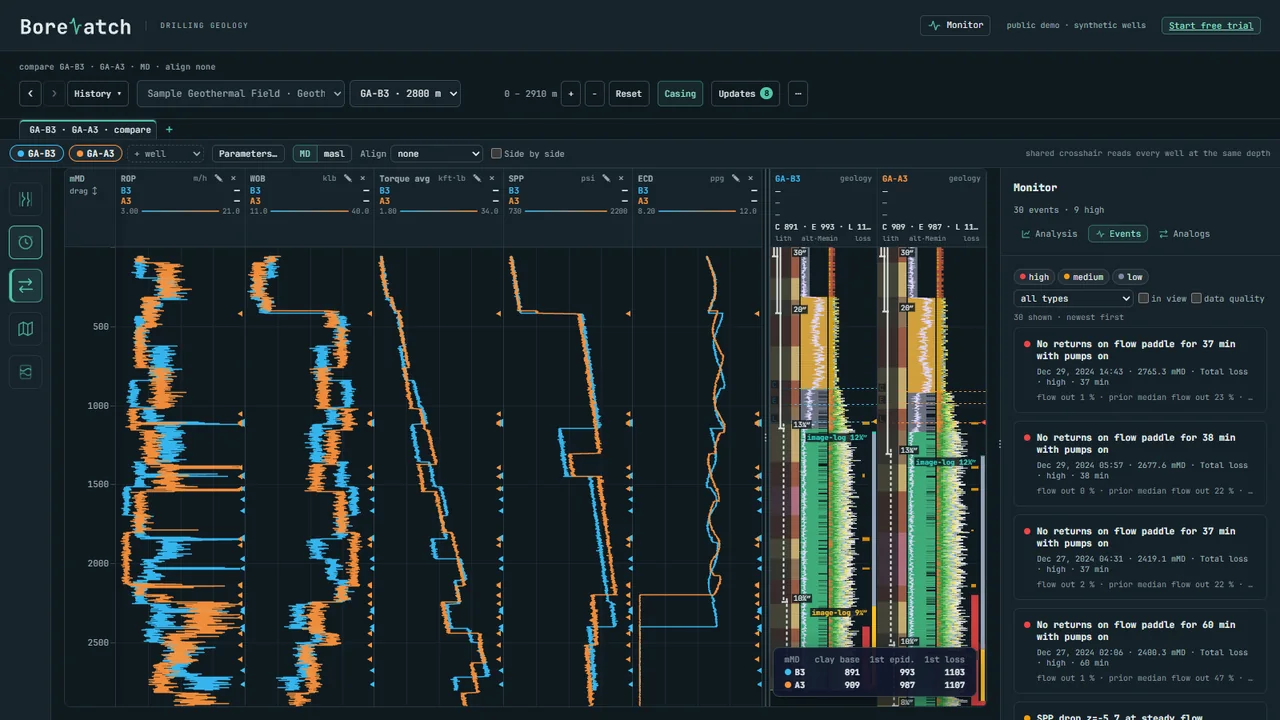
Compare wells
Click the compare icon in the rail.
Add wells with + well: 2 to 10 wells at a time, each in its own colour.
Choose MD or masl (elevation), and Align them on a geological marker if you want.
Tick Side by side to put the wells next to each other instead of on top of each other.
A shared crosshair reads every well at the same depth.
Tip Multi-well Compare is an optional add-on; the trial includes it.
Map and 3D
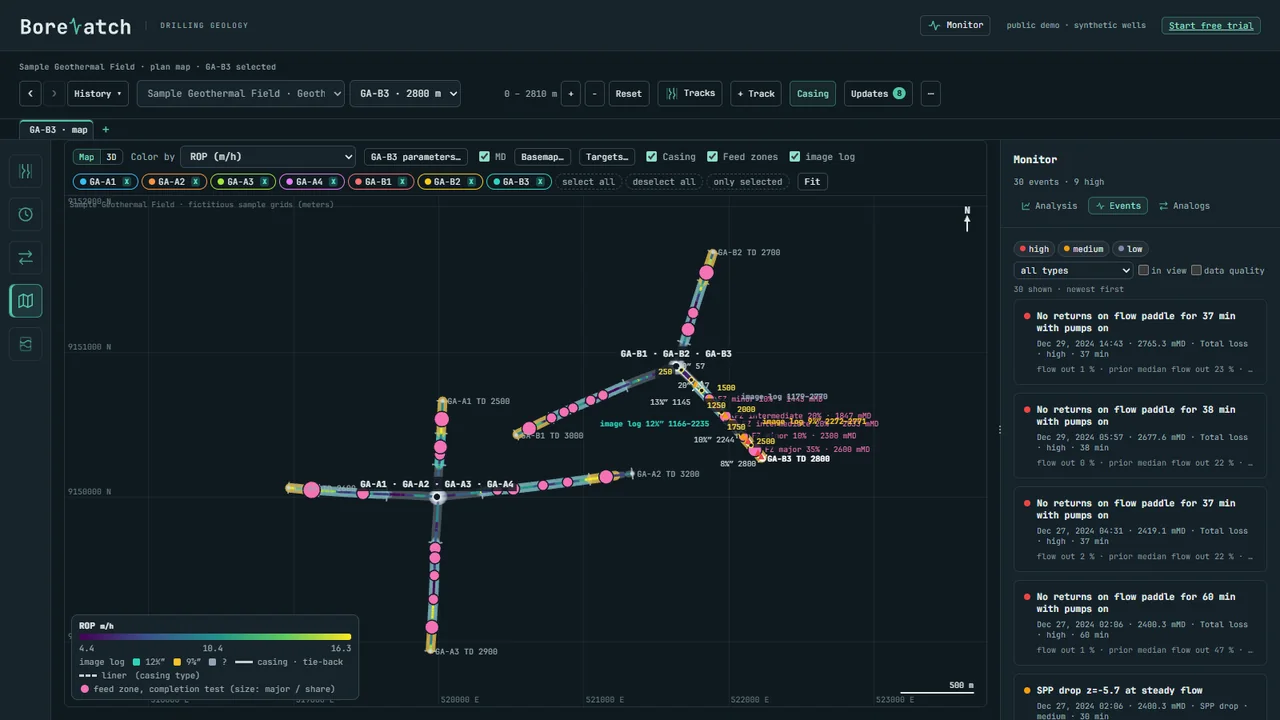
Plan map
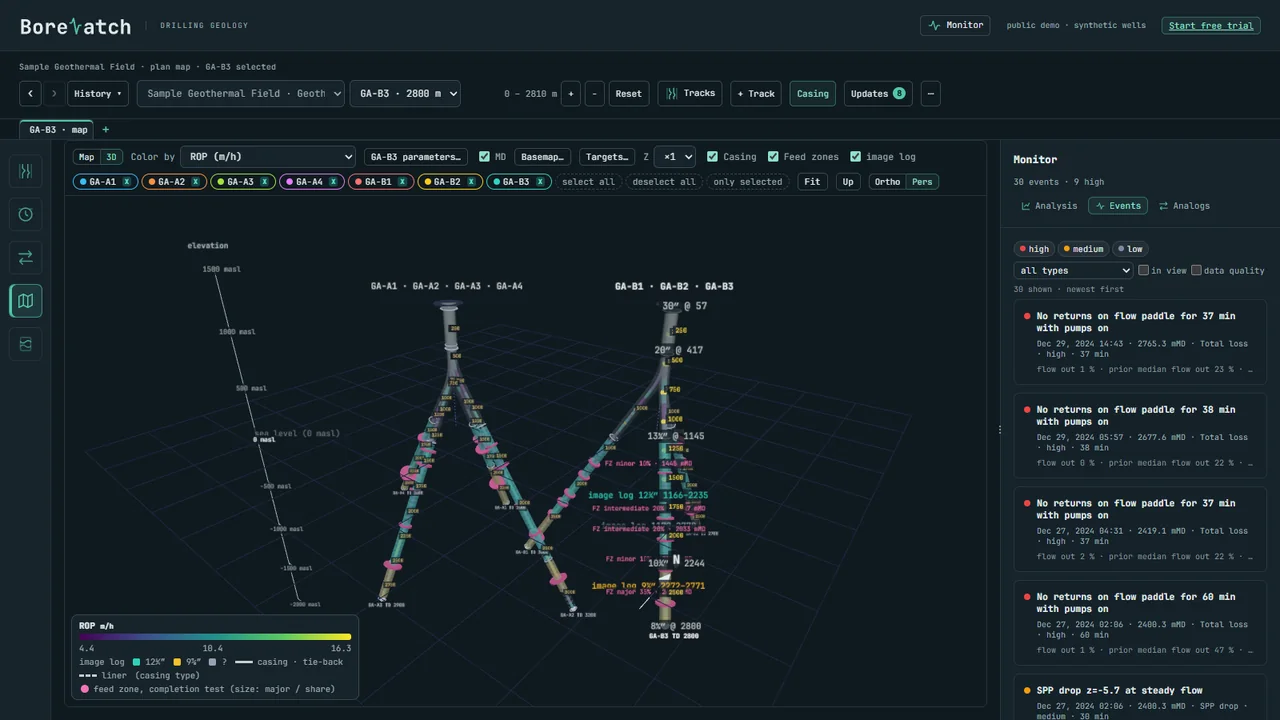
Click the map icon in the rail. The plan map shows every well path seen from above, coloured by the parameter you choose in Color by. Basemap adds a background map and Targets shows planned targets.
3D view
Click 3D next to Map.
Click select all to show every well of the field.
Drag to turn the view, scroll to zoom; Fit brings everything back on screen and Up sets north up.
Use Z × to stretch the depth, and Ortho or Pers for a flat or perspective view.
Tick Casing, Feed zones and image log to show them on the well paths.
Tip Map and 3D Trajectories is an optional add-on; the trial includes it.
Image logs
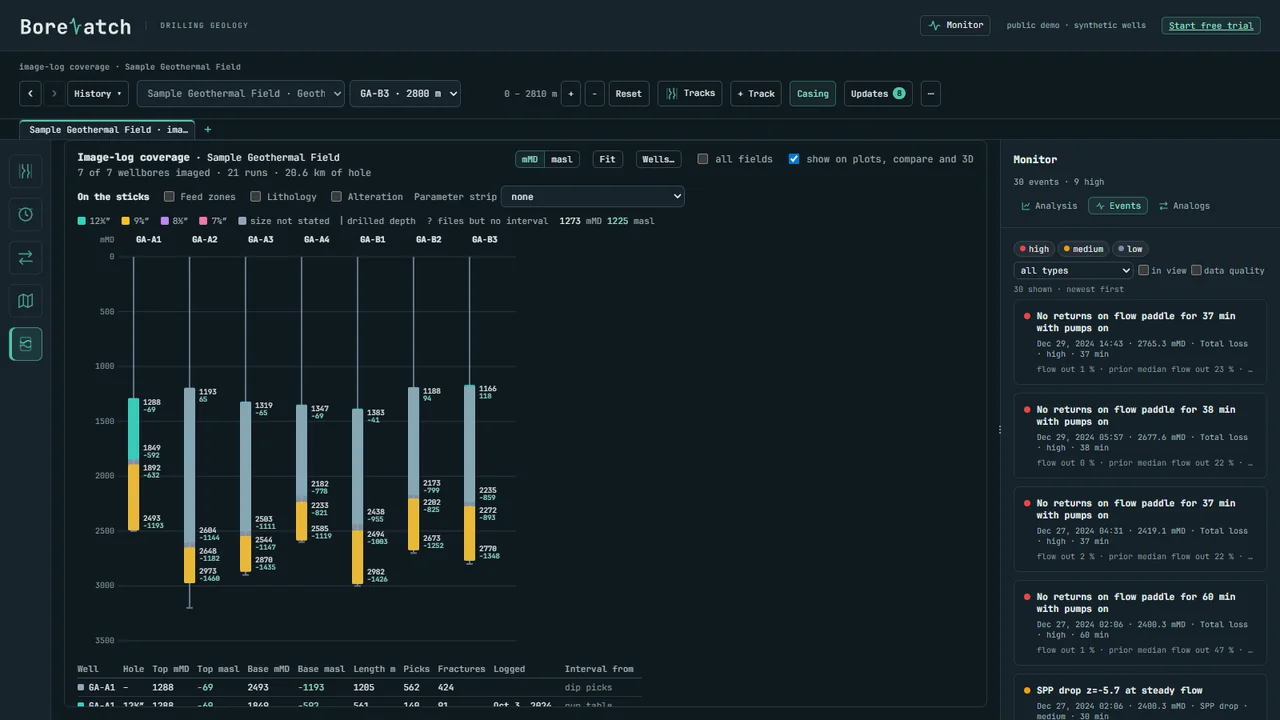
The last rail icon shows where borehole image logs were run in each well and what they cover, so you can see at a glance which intervals have fracture data.
More tools
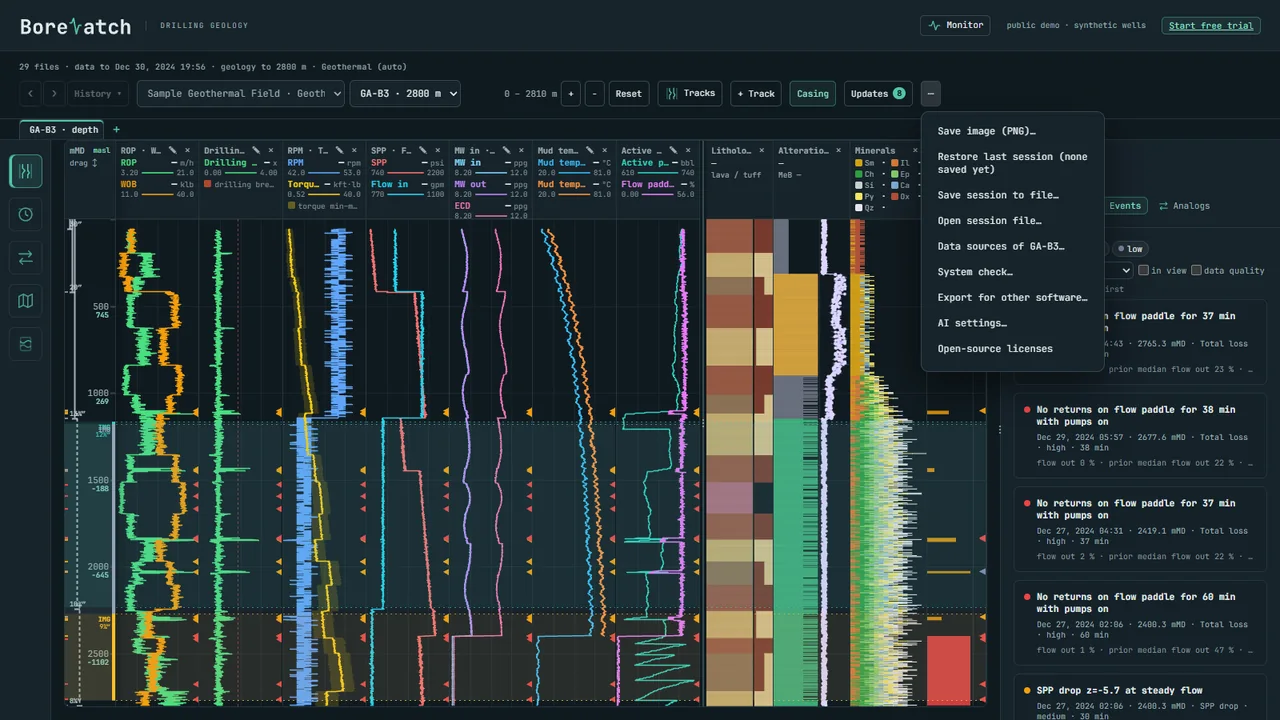
The ⋯ button at the end of the control row holds the tools you need less often. The next pages go through each of them.
Sessions
Save session to file… saves the open wells, views, zoom and layout to a small file; Open session file… brings them back, on this or another computer. Restore last session reopens what you had before.
Save an image
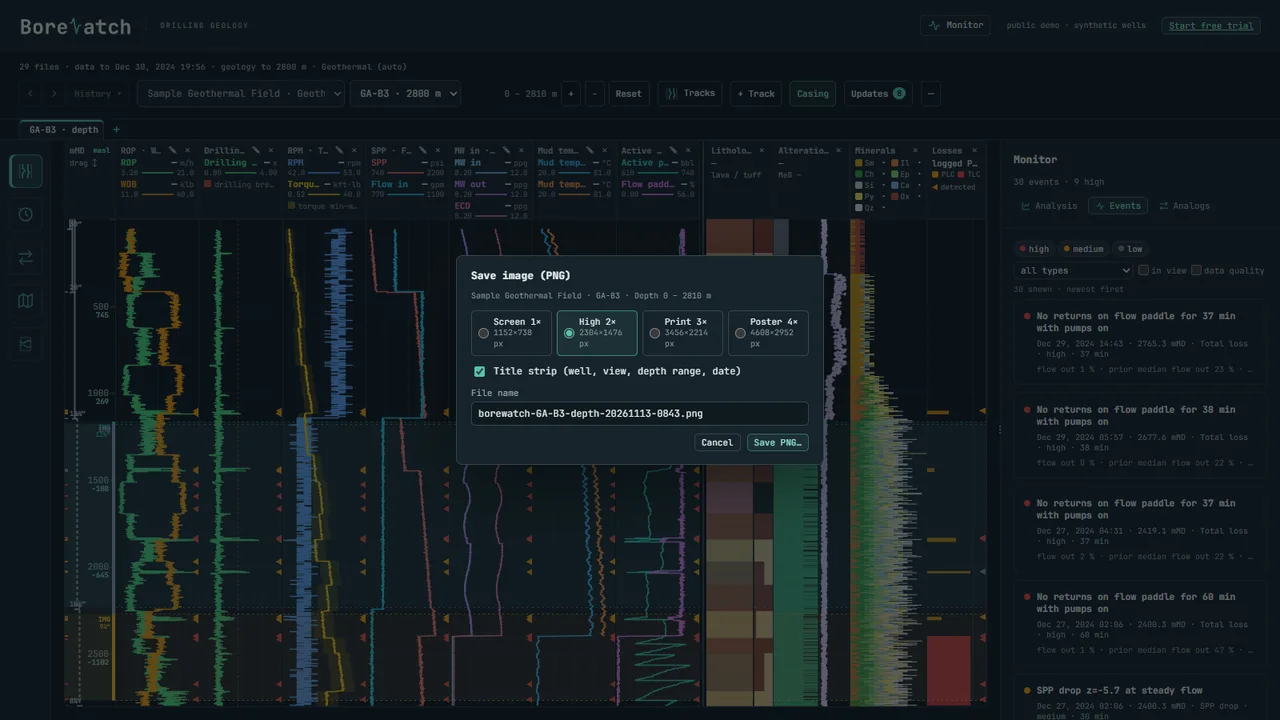
Choose the size: Screen 1×, High 2×, Print 3× or Poster 4×. Keep Title strip ticked to print the well, view, depth range and date on the picture. Edit the file name and click Save PNG.
Data sources of a well
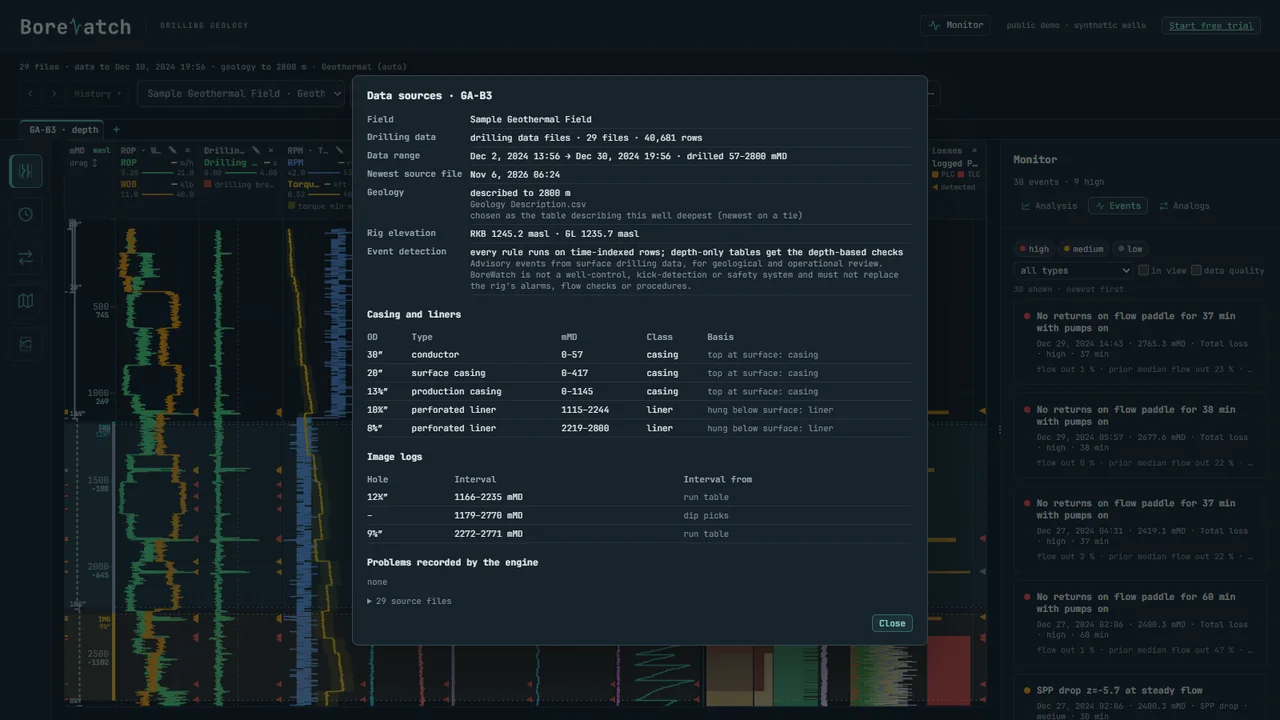
This shows where every part of the well comes from: the drilling files and their date range, the geology tables, the rig elevation, the casing and liners, the image logs, and any problems the engine recorded while reading the files.
System check
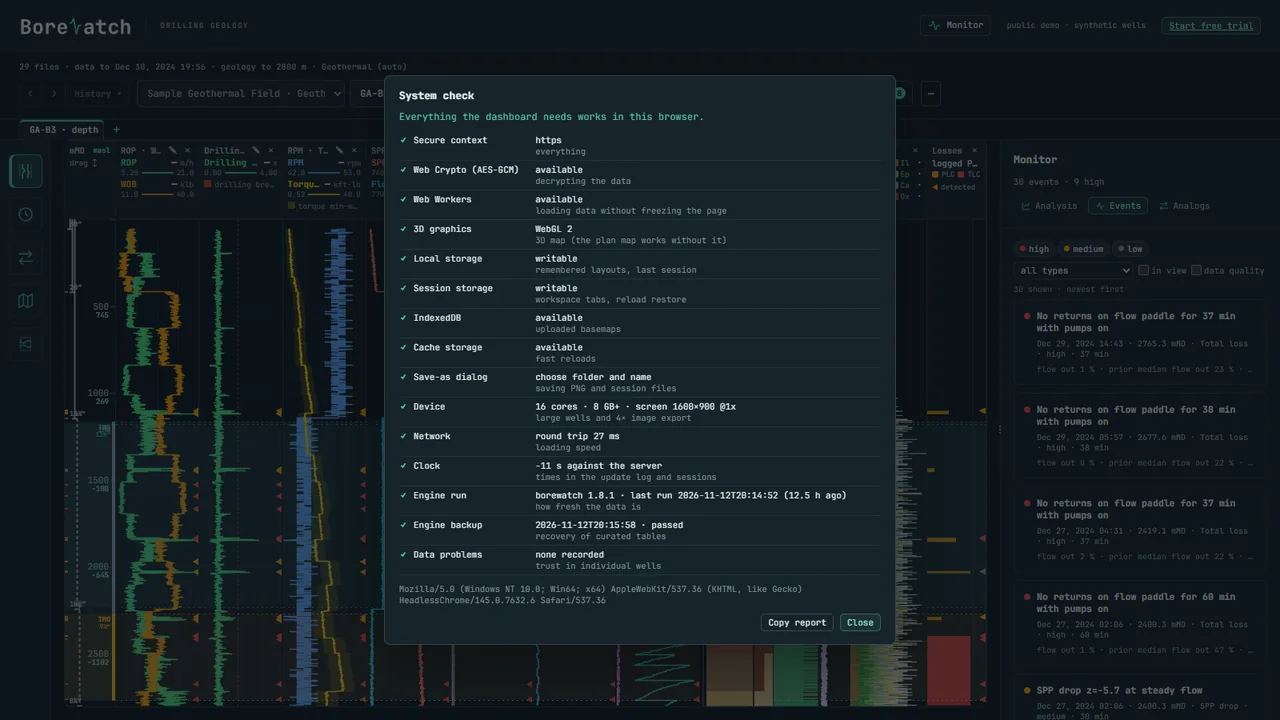
A quick check that this browser has everything the dashboard needs (encryption, 3D graphics, storage) and when the engine last ran. Copy report copies it for a support email.
Export to your software
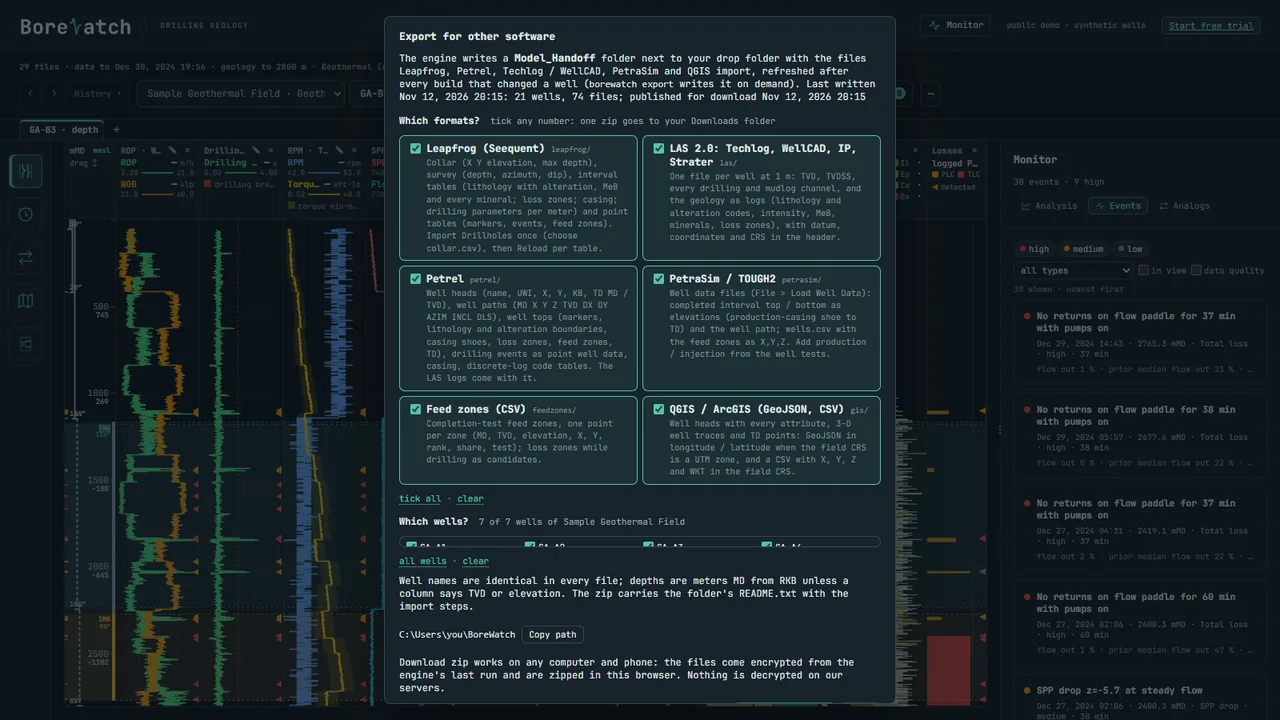
The engine prepares the same processed well for each package, so every platform shows the same numbers.
Open ⋯ → Export for other software….
Tick the formats: Leapfrog (collar, survey, intervals and points), LAS 2.0 (Techlog, WellCAD, IP, Strater), Petrel (well heads, well paths, well tops, events, LAS), PetraSim / TOUGH2 (well data files), Feed zones (CSV) and QGIS / ArcGIS (GeoJSON, CSV).
Tick the wells.
Click Download zip. The files come encrypted from the engine and are unzipped in your browser; the zip includes a README with the import steps for each package.
Tip Leapfrog gets dip as inclination minus 90°, so a vertical well has a dip of −90. Leapfrog ticks “negative dip points down” by itself.
AI settings
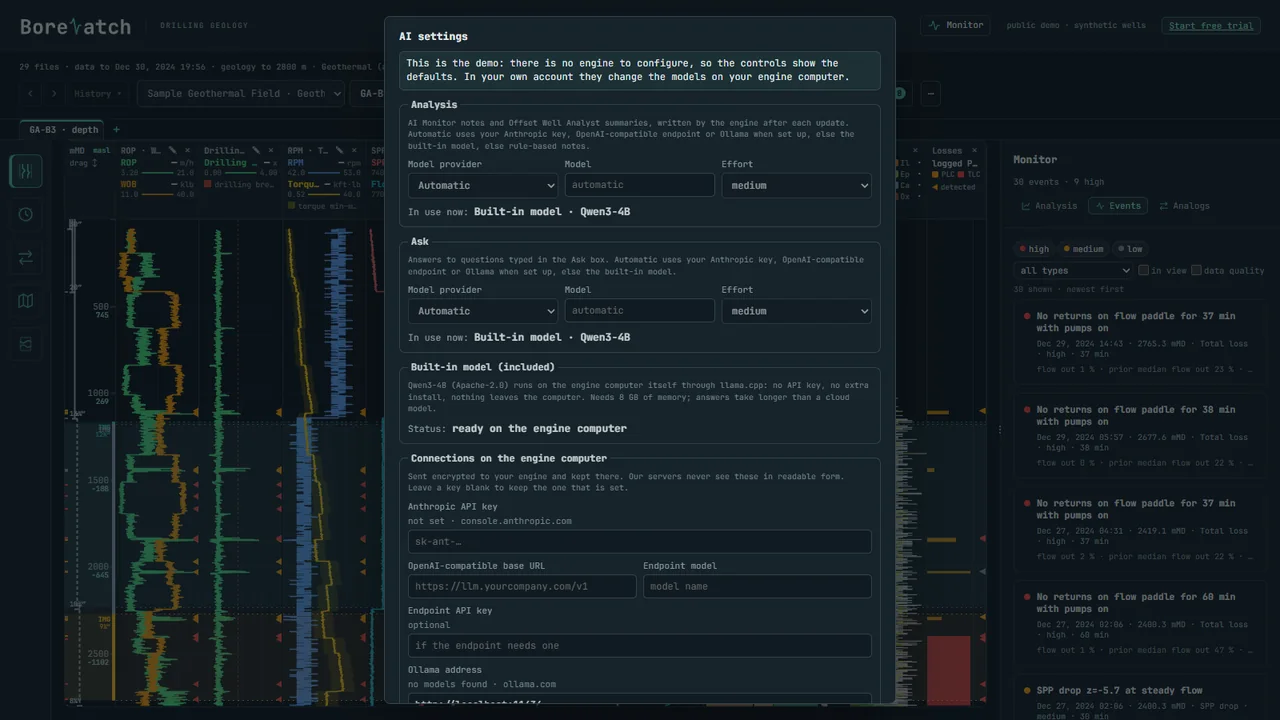
Choose which model writes the analysis and which answers Ask, and how much effort each may take.
Built-in model: runs on the engine computer. No API key; nothing leaves the computer.
Your own Anthropic key, an OpenAI-compatible company endpoint or Ollama: fill in Connections and save. Keys stay encrypted on the engine computer, and only the account owner can change them.
Your account
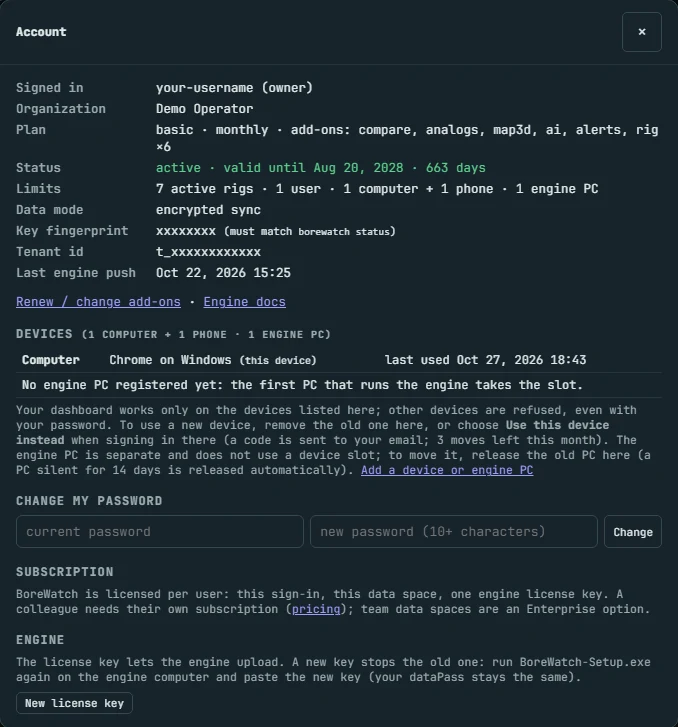
From an example account: names and ids are hidden.
Click your name at the top right. The account window shows your plan and add-ons, until when it is valid, and the limits of your plan.
Devices: the computers and phones that may open your dashboard. Remove an old one to free its place.
Change my password.
New license key: issues a new key for the engine; the old one stops working. Run setup again with the new key.
On a phone
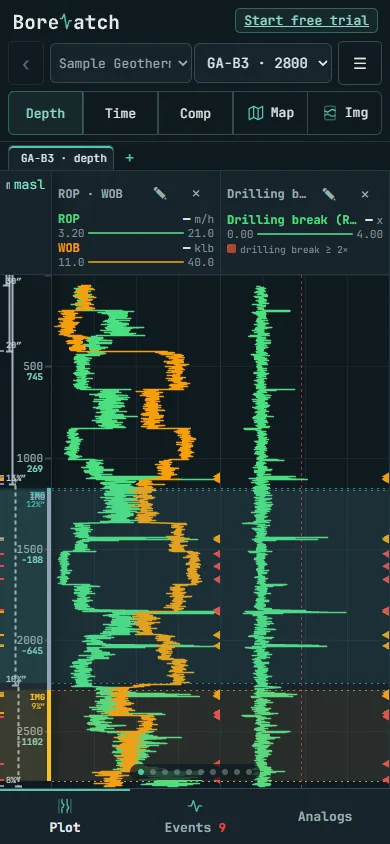
The dashboard works on a phone too: the same wells, views and events, laid out for a small screen. The view buttons sit in the top row and the Monitor opens as a sheet. Add it to the home screen from the browser menu to open it like an app.
Oil and gas, and mineral drilling
The engine works out the industry of each well from its own data and shows the tracks that matter for it. Pick another field in the field list to see them.
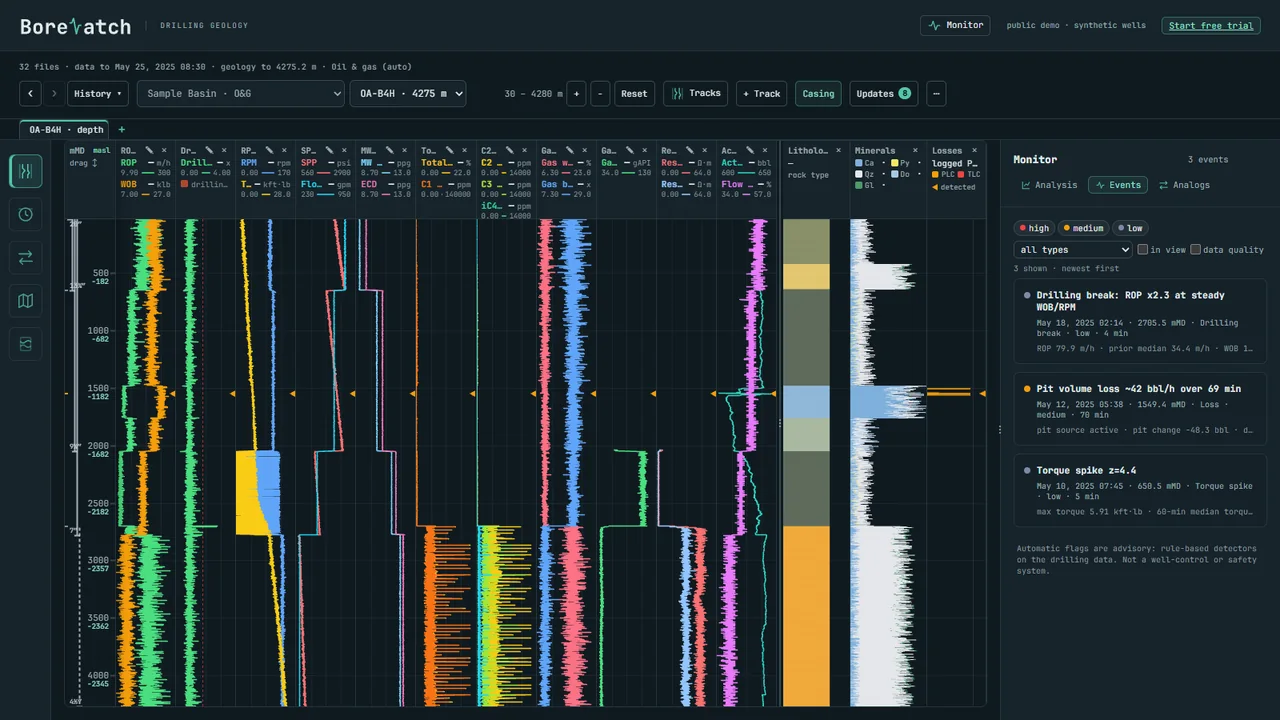
Oil and gas
Gas readings and logs beside the drilling parameters, with kicks and losses flagged.
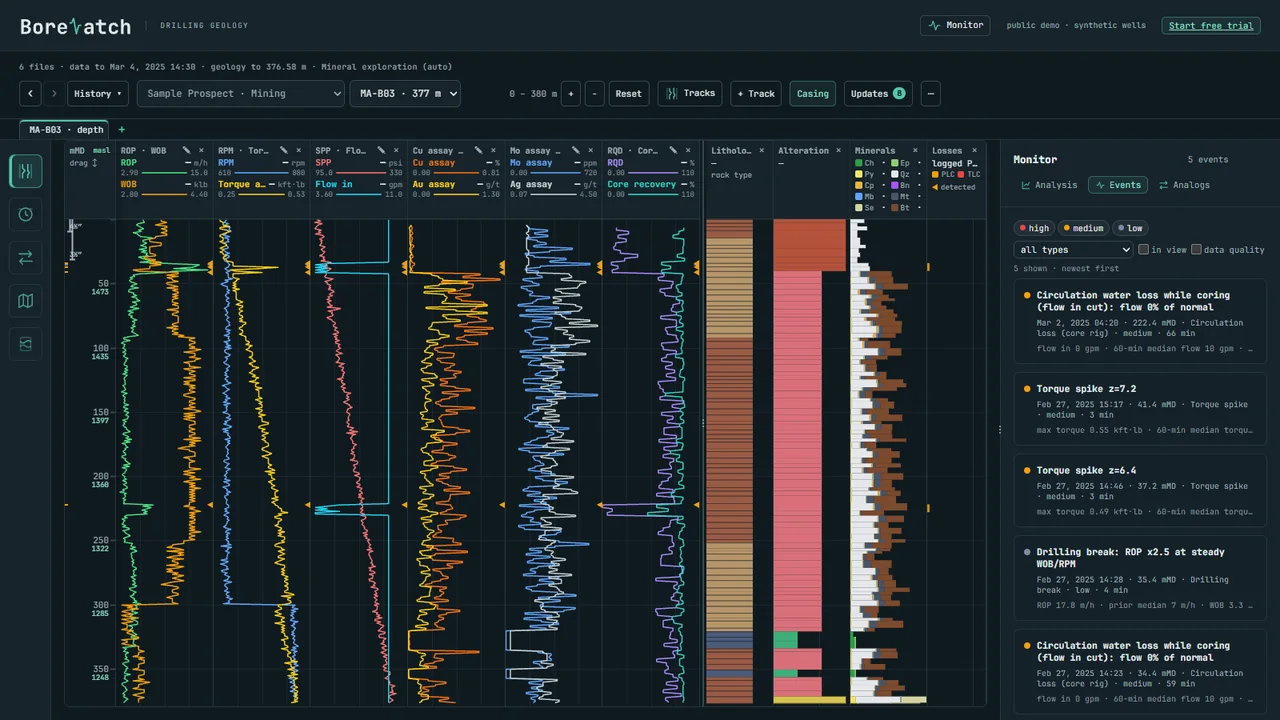
Mineral drilling
Assays and core RQD beside the drilling parameters and the geology of each hole.